Scene 1 · One pane of glass
A dashboard that tells the whole story.
Live-count tiles, instant-action buttons, status donut, ticket priority bars, asset age histogram, and KPI gauges — the reporting layer is built in. No separate dashboarding tool to stand up.
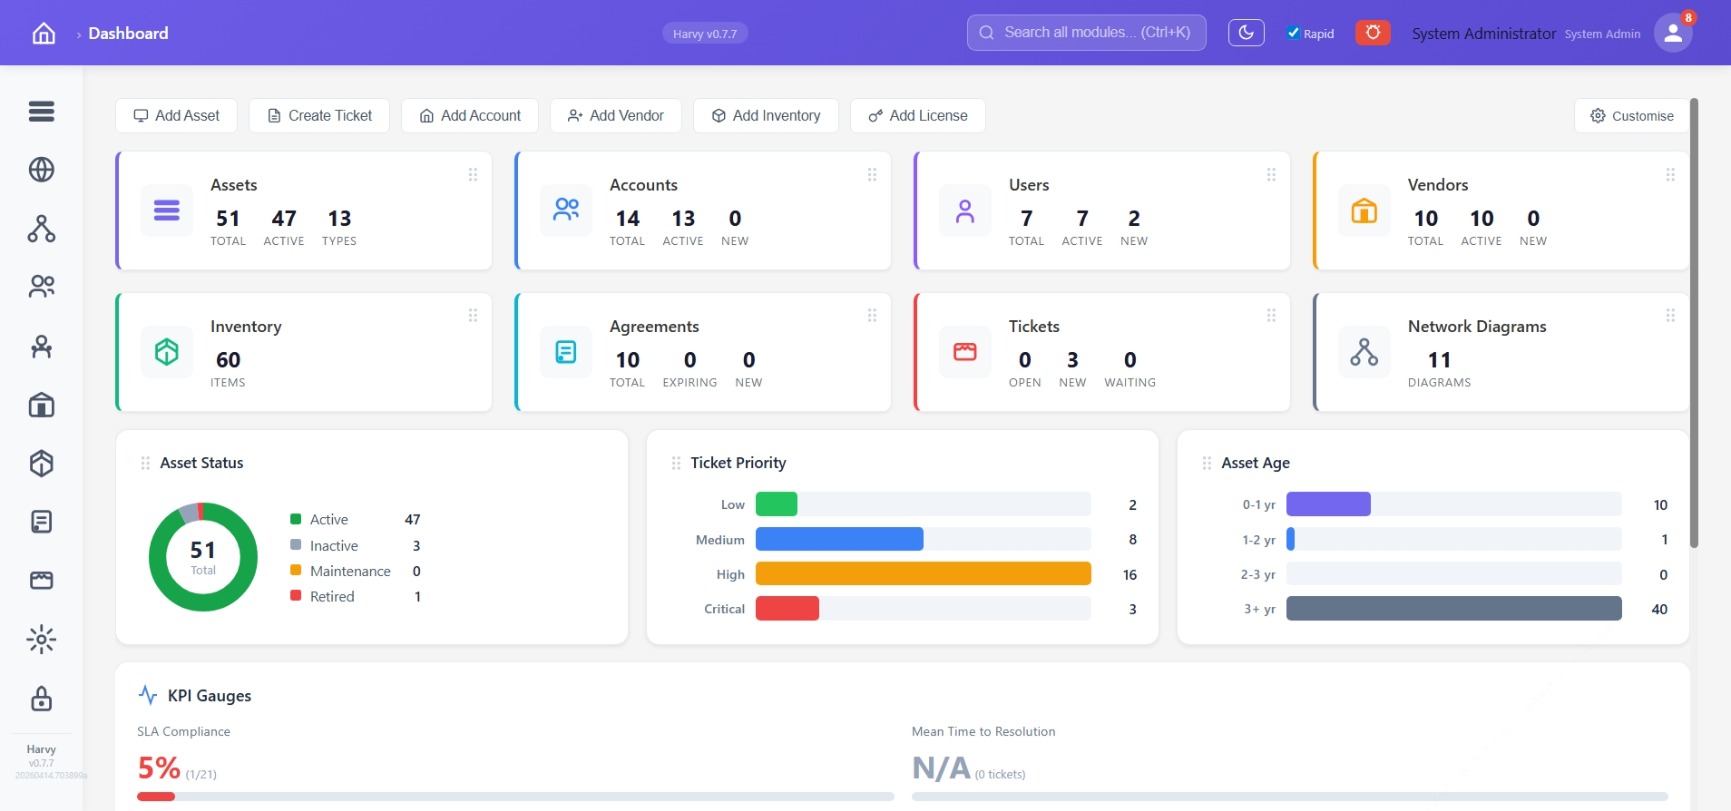
Live counts
Assets, Accounts, Users, Vendors, Inventory, Agreements, Tickets, Network Diagrams — every tile reflects the current database state.
KPI gauges
SLA compliance, mean time to resolution, asset status distribution, ticket priority, asset age — all at a glance.
Customise your view
Draggable tiles, global search (Ctrl+K) across every module, dark mode, role-aware layout.
Scene 2 · Asset lifecycle with live telemetry
Assets that know themselves.
Filter by type, status, account, location or online status. Every endpoint runs a reporting agent — CPU, disk, uptime, and the full software inventory automatically collected.
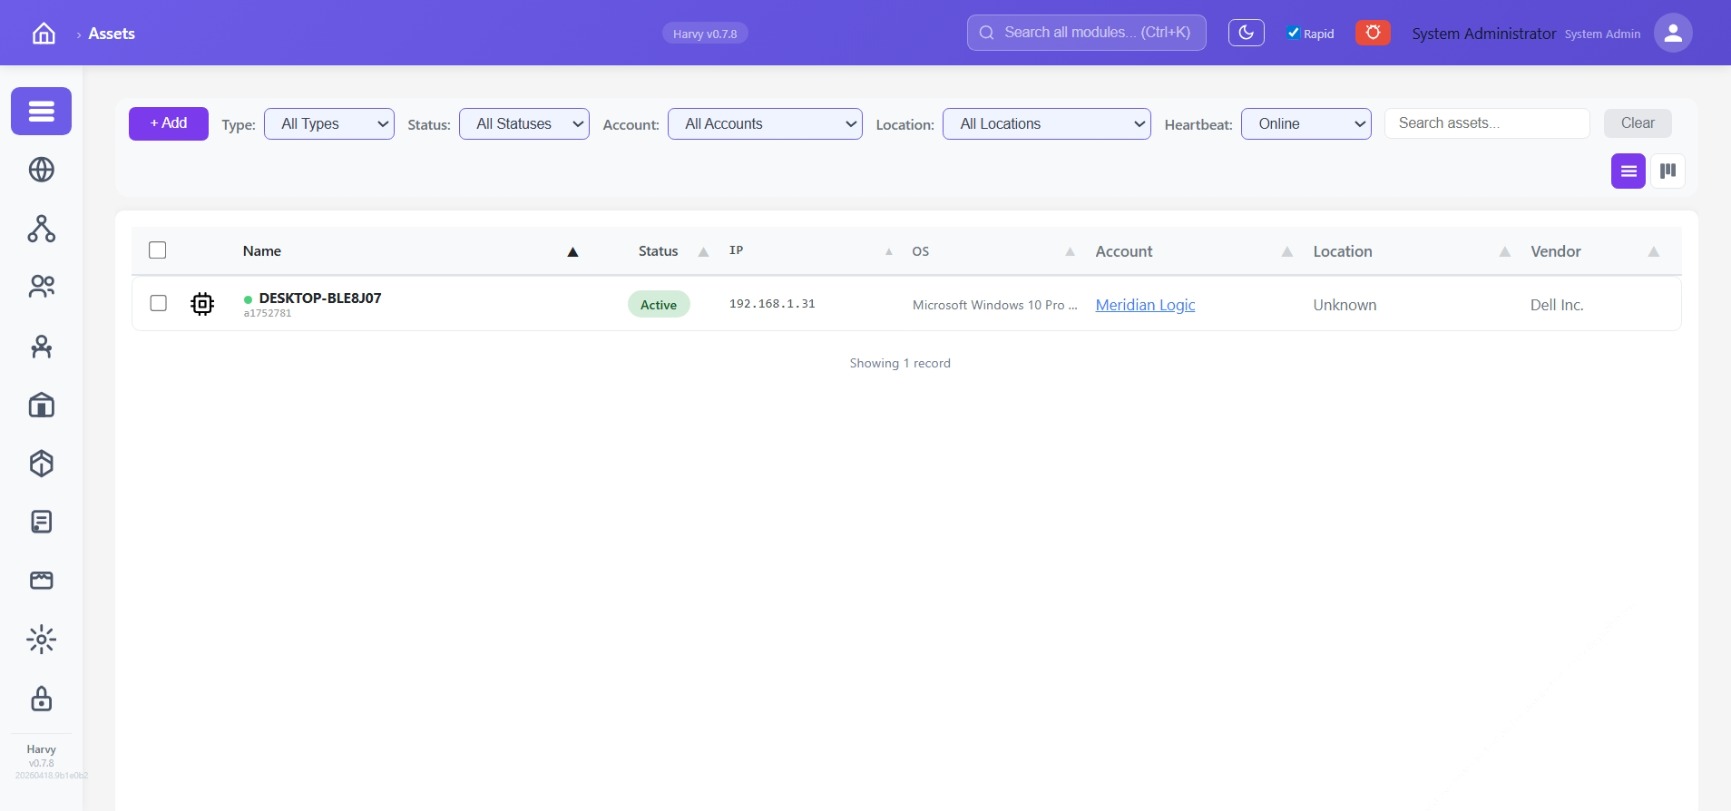
Five-axis filtering
Type, status, account, location, heartbeat — combine to isolate any fleet slice.
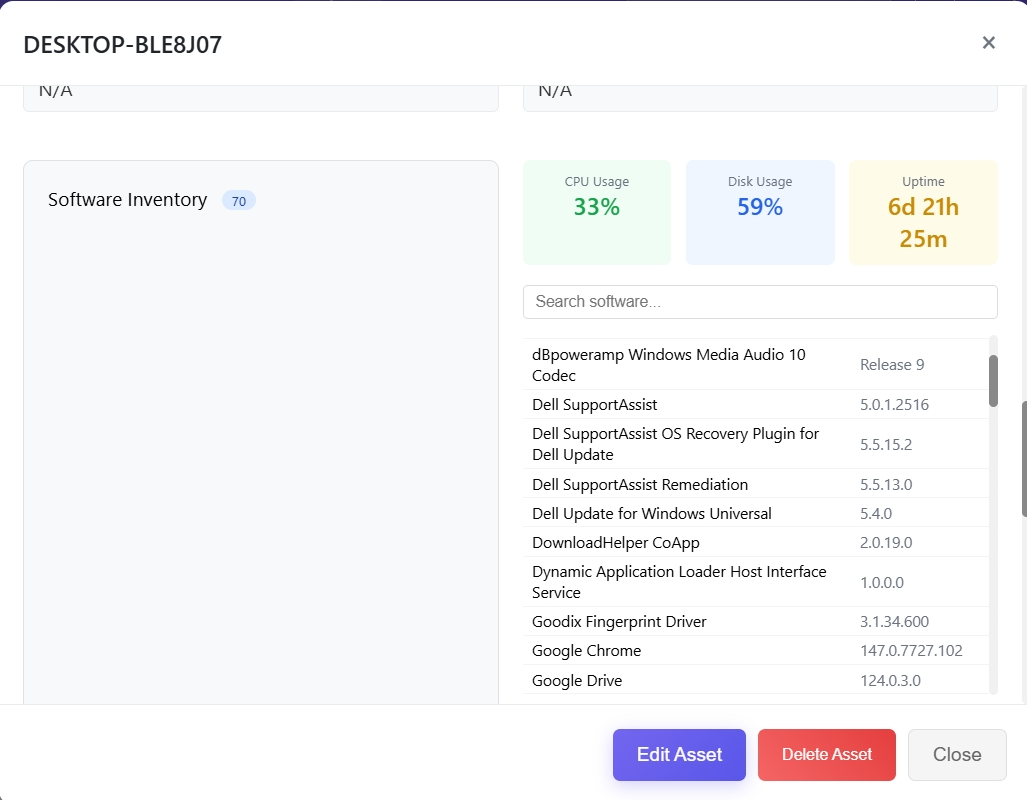
Agent-collected inventory
CPU, disk, uptime and the full installed-software list with versions. No manual entry.
One-record drilldown
Pivot from software to licence to ticket to user to account without cross-system joins.
Scene 3 · Service desk with SLA signal
Tickets you can actually manage.
Incidents and service requests, priorities from low to critical, SLA colour-coded and live — green healthy, amber warning, red overdue with the time past due spelled out. Switch to Kanban with one click.
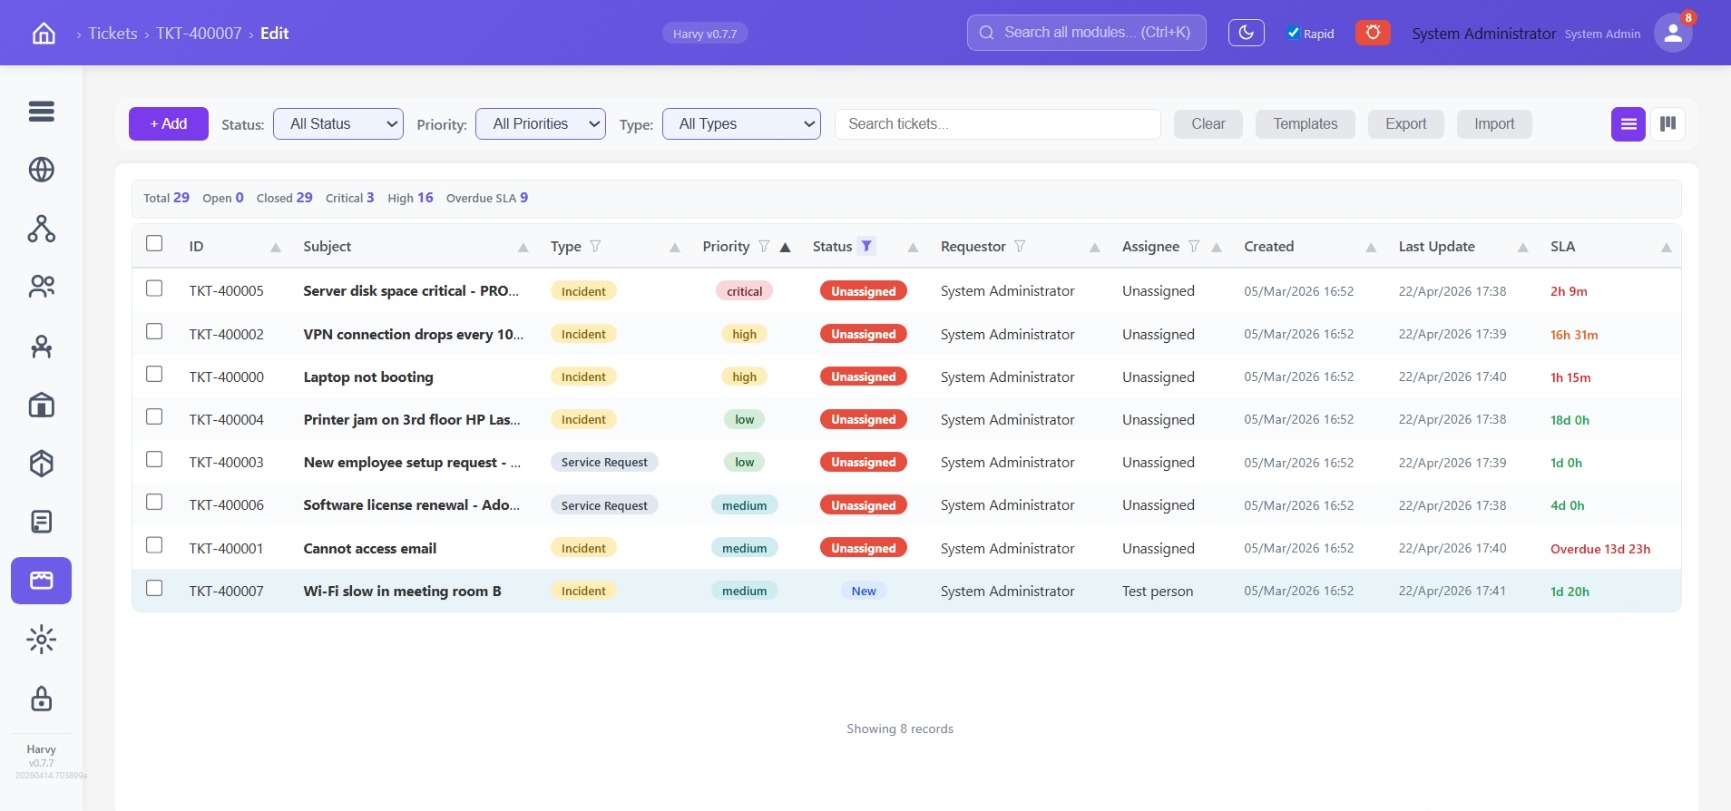
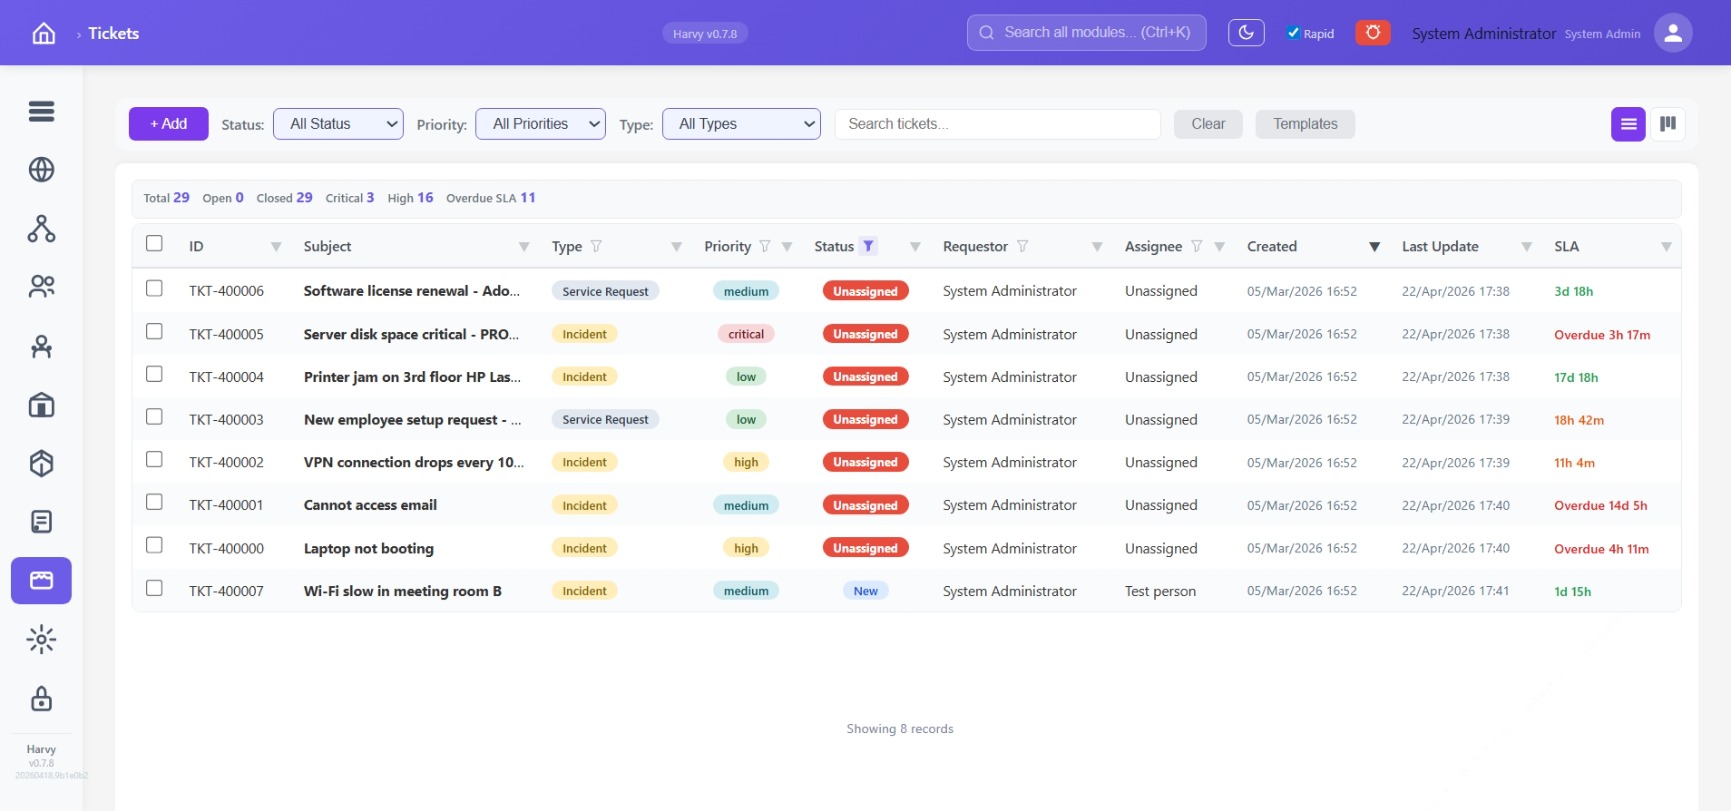
Live SLA
Every row tells you time remaining or time past due. Counters at the top drive dashboard KPIs.
Templates
Pre-canned ticket flows for common incidents — create one with a click, never retype.
Kanban view
Same data, board layout. Drag to change status; filters persist across views.
Column drilldown
Per-column filter icons — narrow by priority, assignee, requestor, or SLA state without leaving the list.
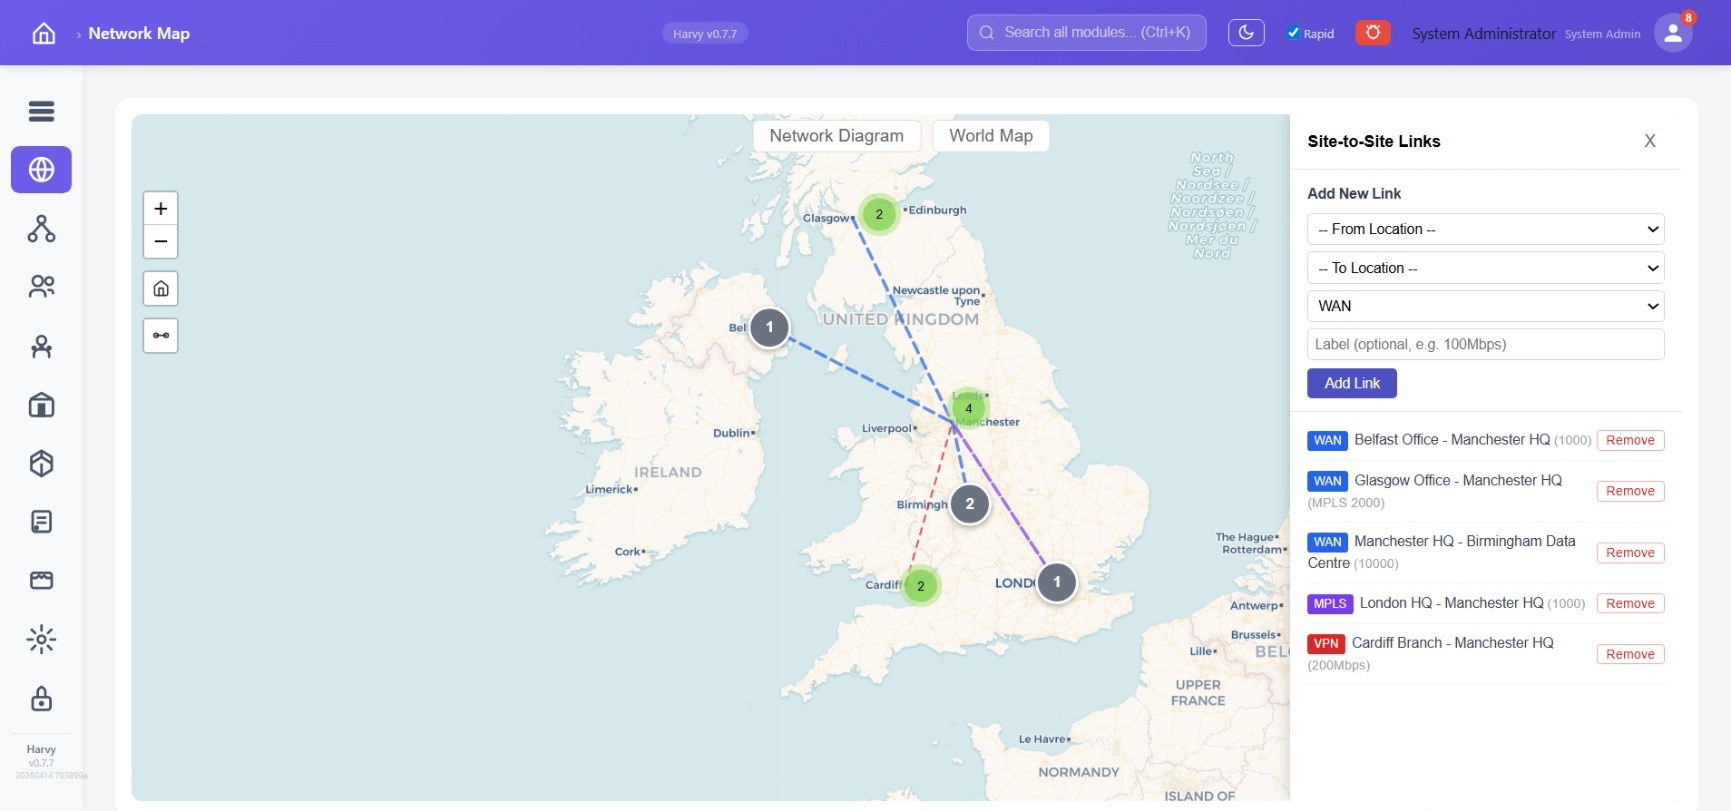
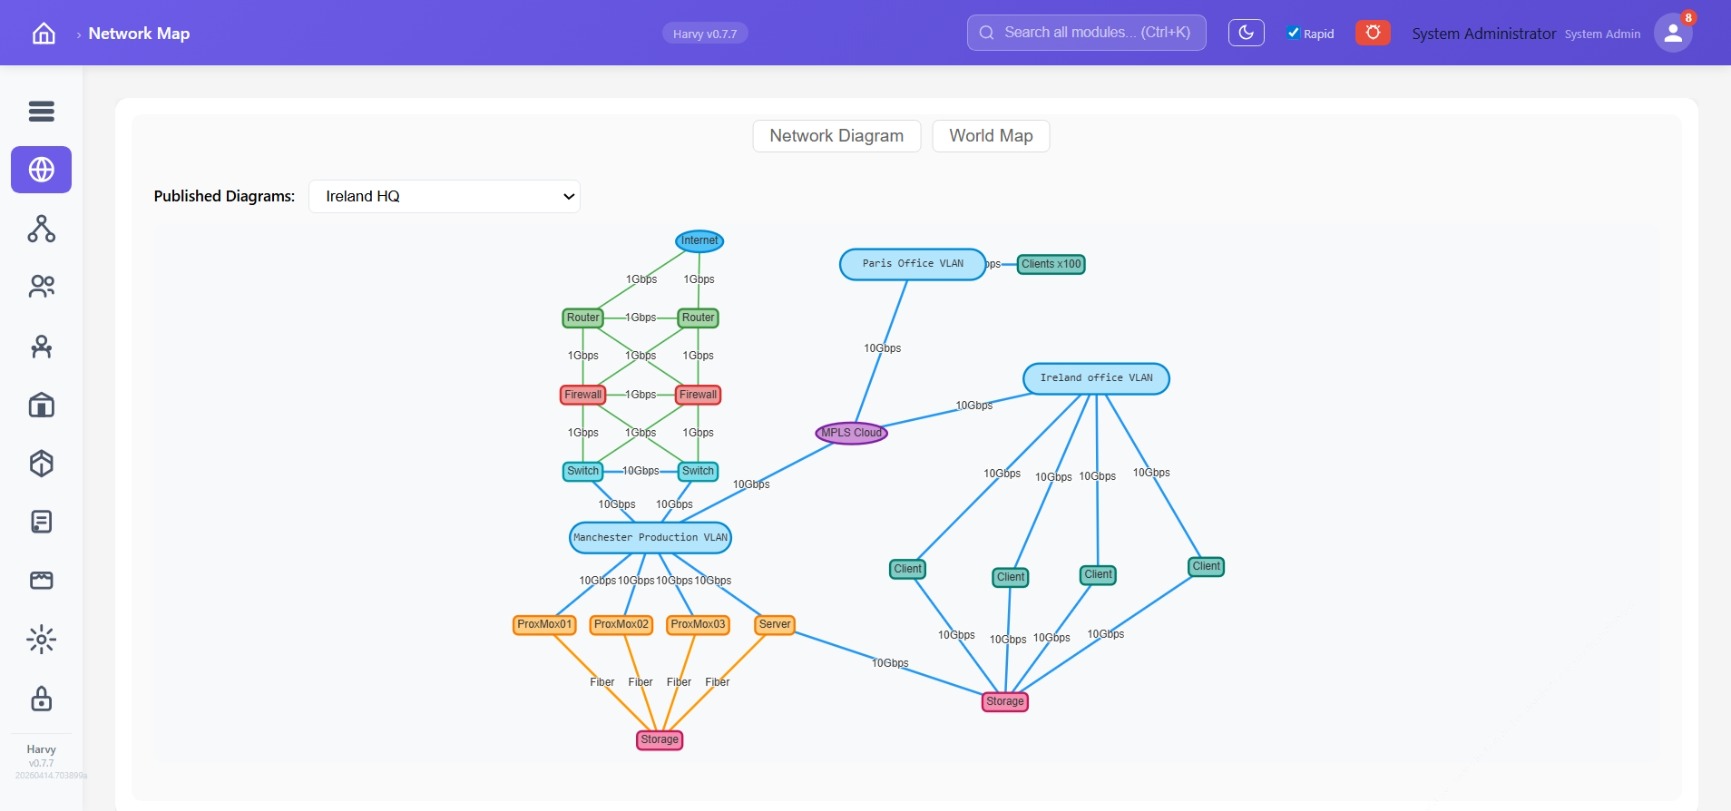
Scene 4 · The network, spatially
Your distributed estate on a live map.
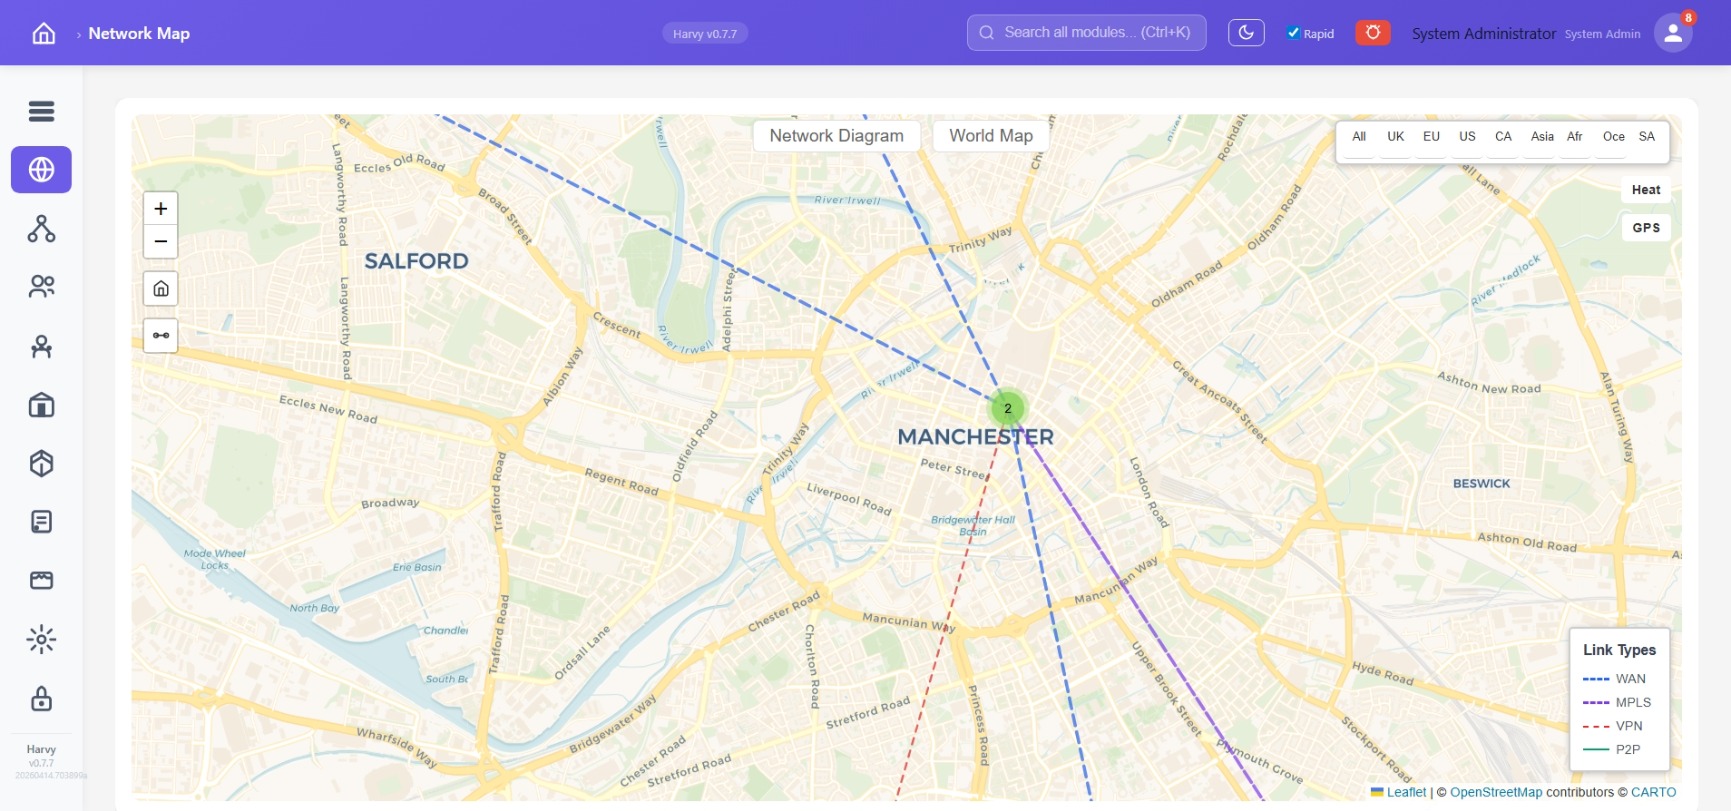
Every site is a pin, clustered as you zoom out, expanded as you zoom in. Site-to-site links colour-coded by type (WAN, MPLS, VPN, P2P). Zoom all the way to street level. Live agent pulse shows which endpoints are online right now.
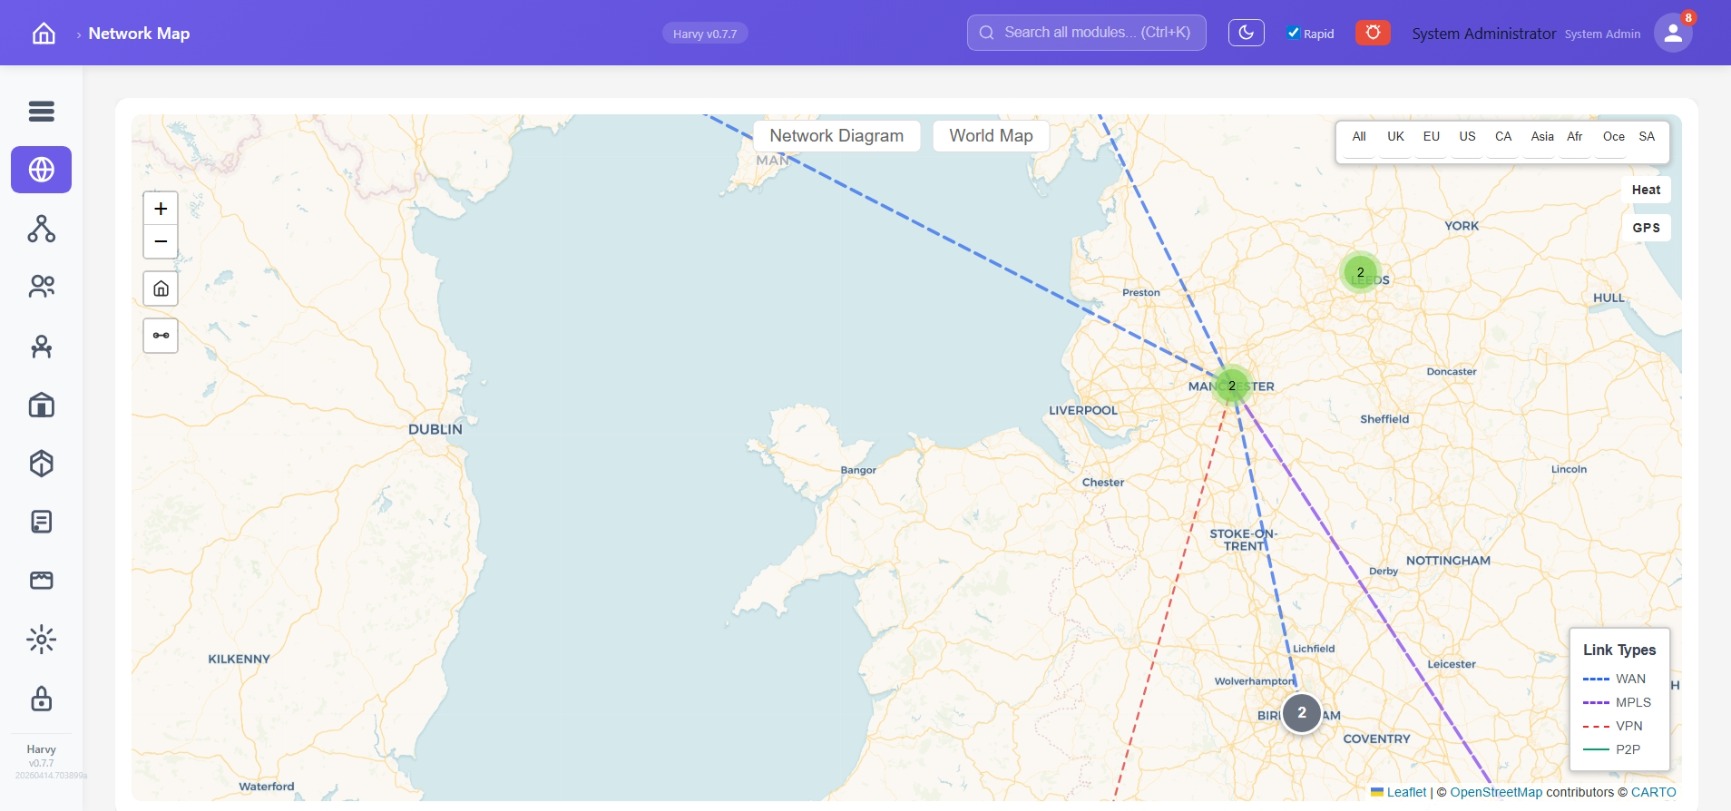
Region filters
UK / EU / US / CA / Asia / Africa / Oceania / South America — focus the map on the estate you run.
Add links in seconds
Pick two locations, pick a link type, label the bandwidth. Renders live — no diagram-tool round-trip.
Live agent pulse
Green pulsing markers show endpoints currently reporting in. Remote-hands know exactly where to dispatch.
Heat & GPS overlays
Device density and GPS-tagged asset layers toggle on top of the map.
Scene 5 · Topology engineers use
Network diagrams that stay current.
Drag-and-drop nodes — Internet, MPLS, Router, Firewall, Switch, VLAN, Server, Storage, VM, Client, Device. Connect with bandwidth labels. Snap to grid, auto-layout, full version history. Draft or publish. Export to PNG for change tickets.
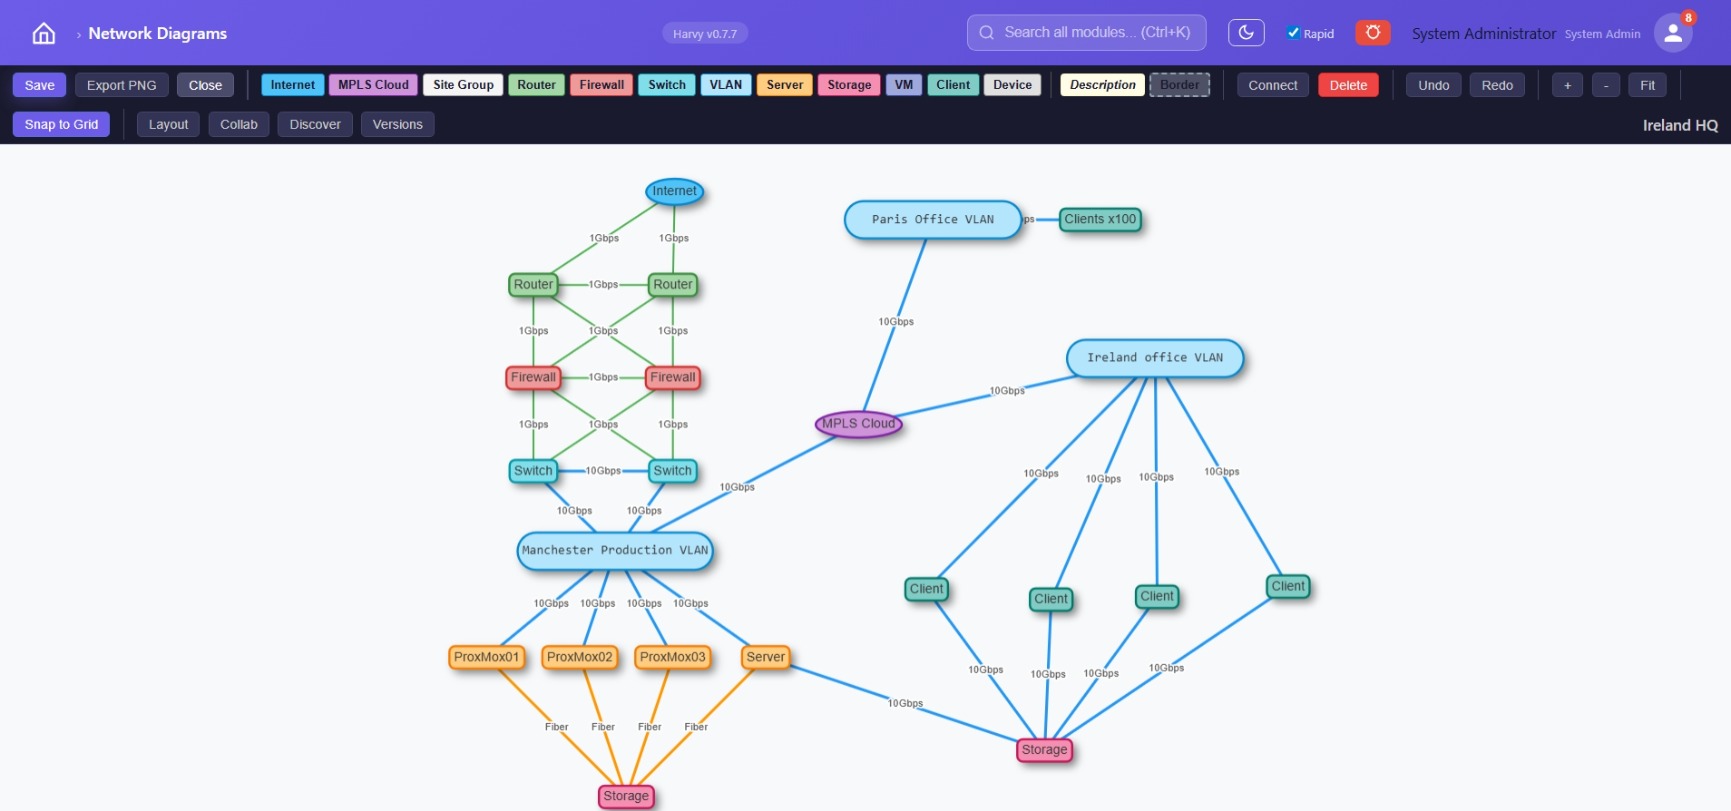
Rich node palette
Eleven node types covering every layer from Internet down to individual devices.
Bandwidth labels
Every link carries its speed — engineers triage incidents using real capacity, not guesses.
Version history
Roll back to any saved version. See who changed what. Never lose a working diagram.
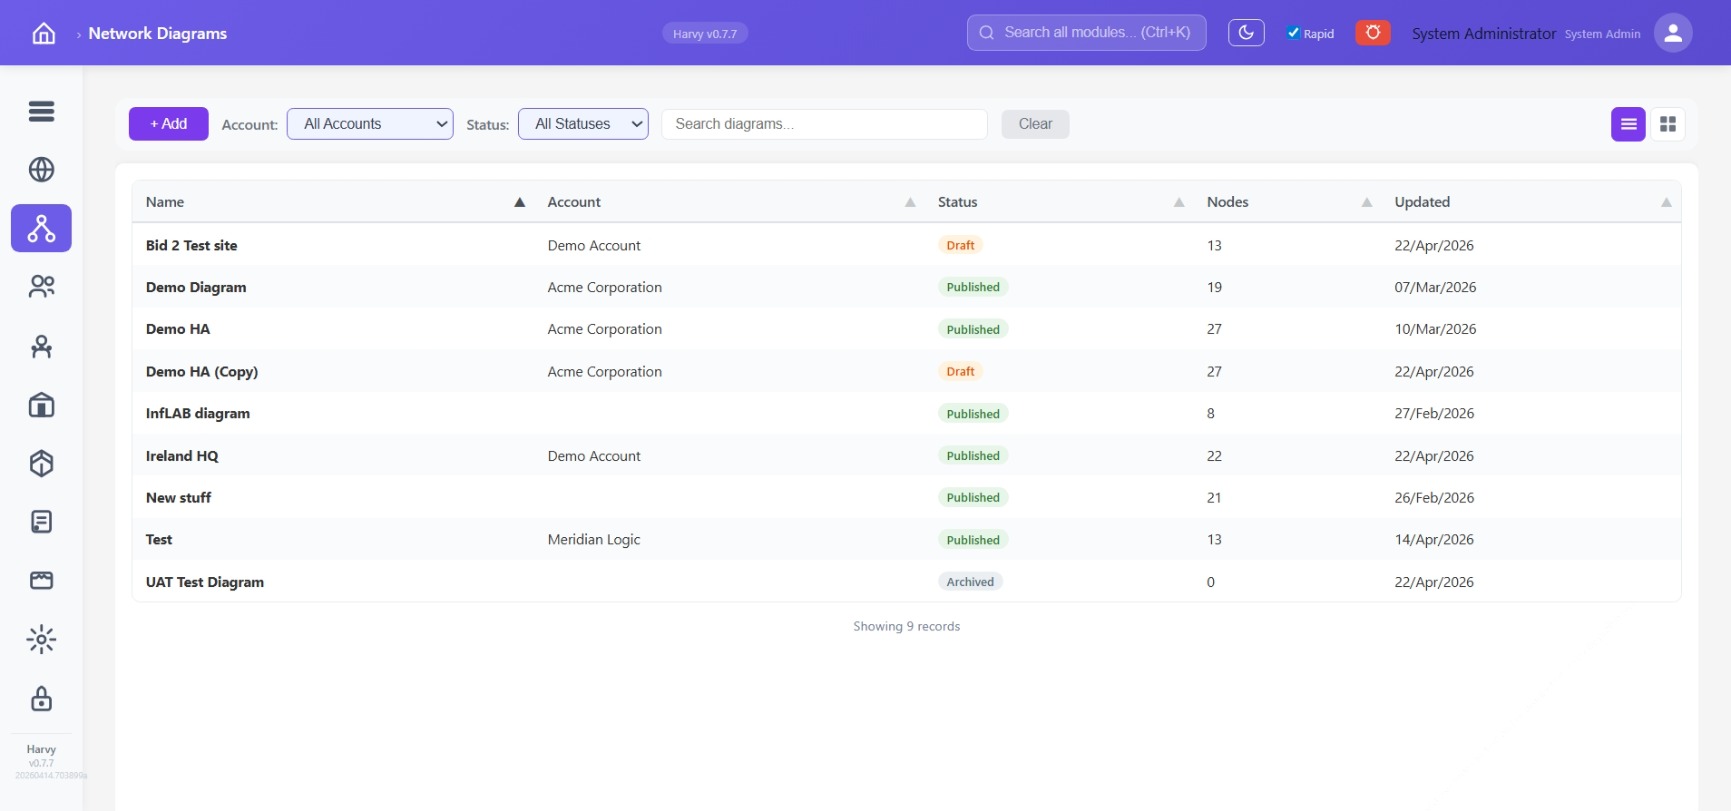
Per-account diagrams
Each customer gets their own diagrams — MSP teams run twenty tenants without cross-contamination.
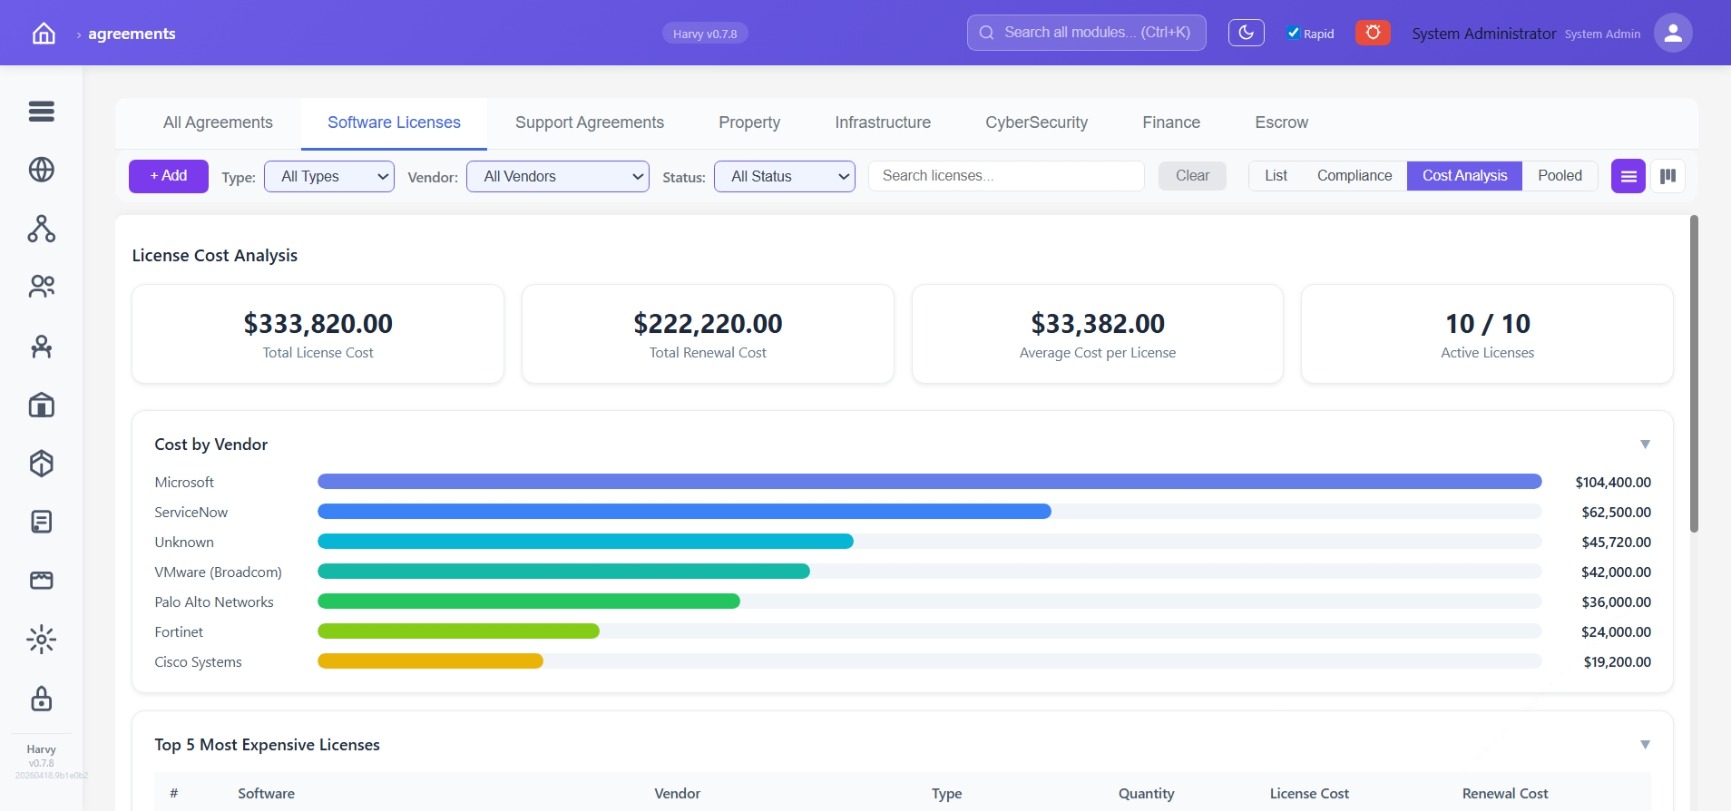
Scene 6 · Vendor & licence governance
Renewals that don't surprise you.
Vendors in a lifecycle — Active, Under Review, Expiring, Inactive. Licences across eight categories: Software Licences, Support, Property, Infrastructure, CyberSecurity, Finance, Escrow, All. Cost Analysis ranks spend by vendor so finance knows where renegotiation matters most.
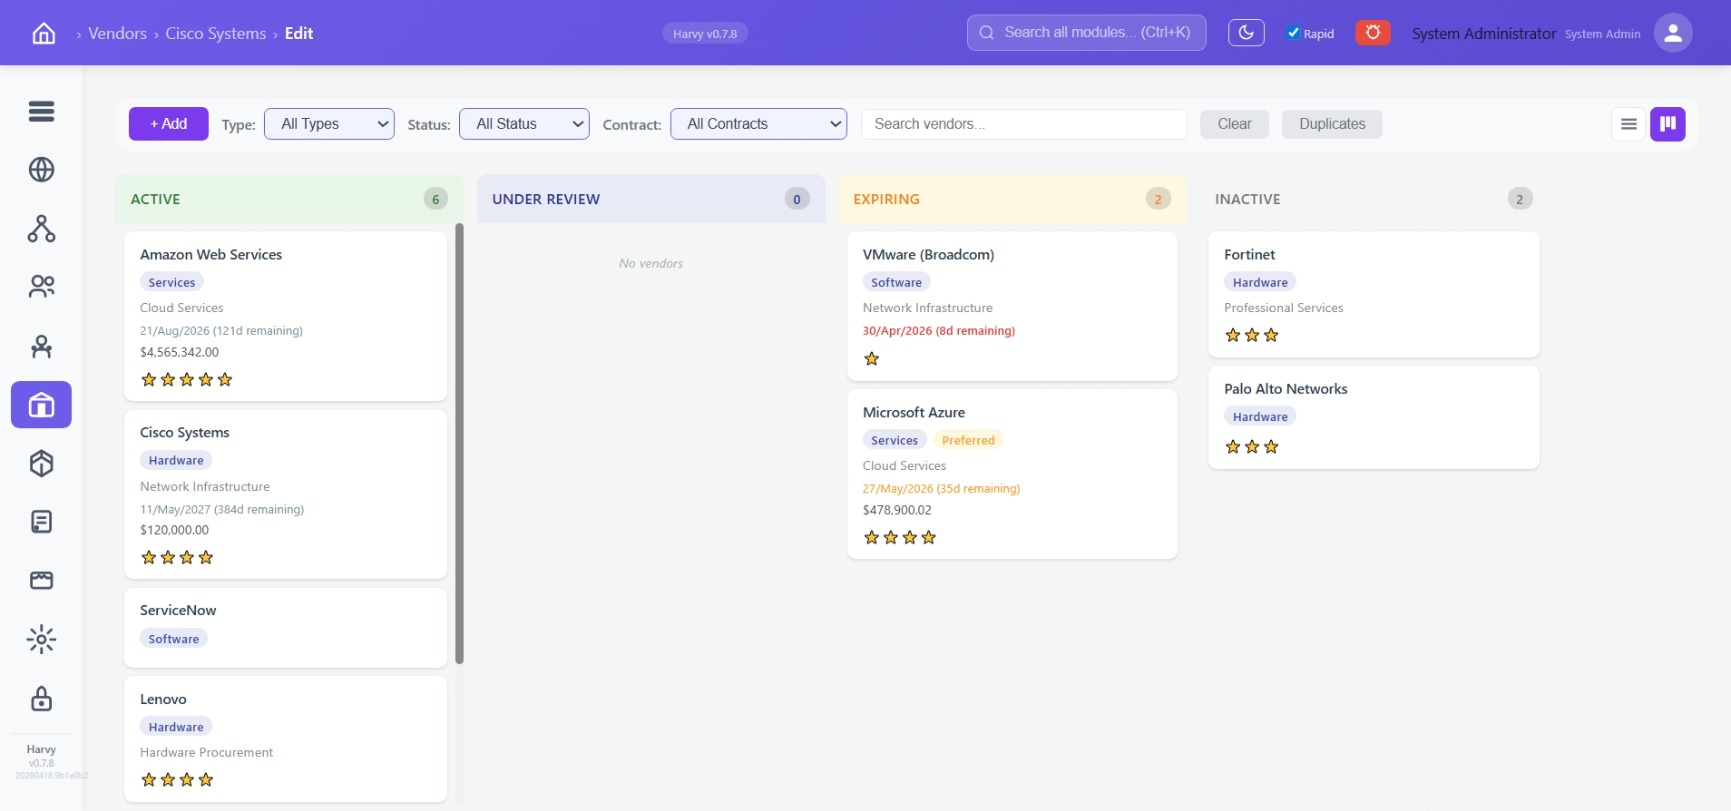
Renewal horizon
Every agreement carries its expiry date and days remaining. The Expiring lane is driven by the dates, not by anyone curating a list.
Spend by vendor
Ranked cost breakdown for finance reviews — know where you're concentrated before renewal season hits.
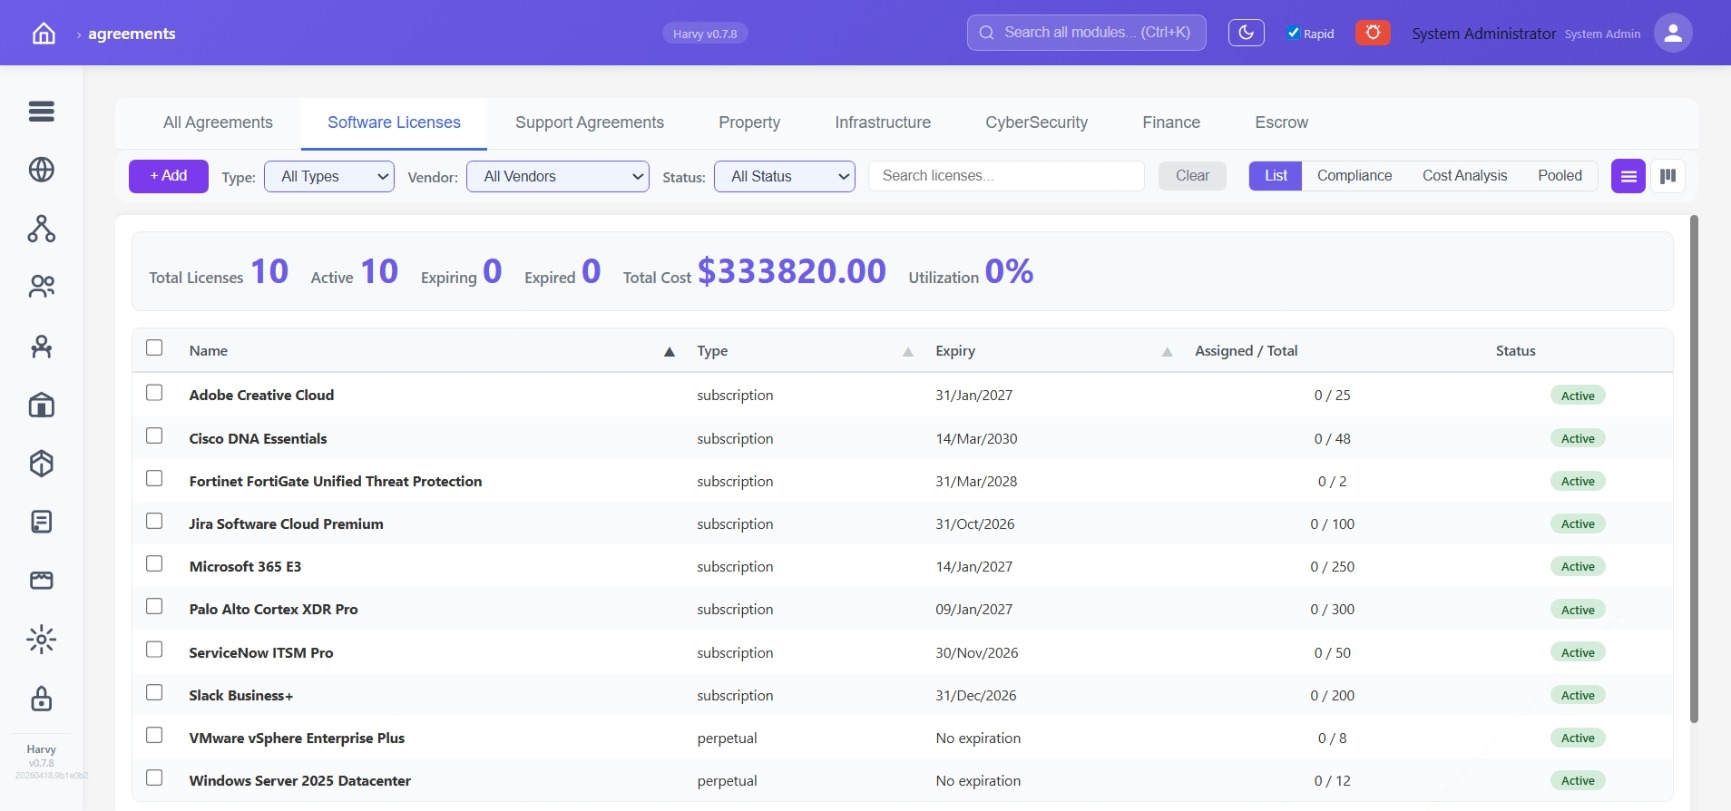
Utilisation per licence
How many seats allocated out of the pool — spot shelfware before the next renewal cycle.
Pooled licences
Dedicated view for licences shared across accounts or departments — allocation visible at a glance.
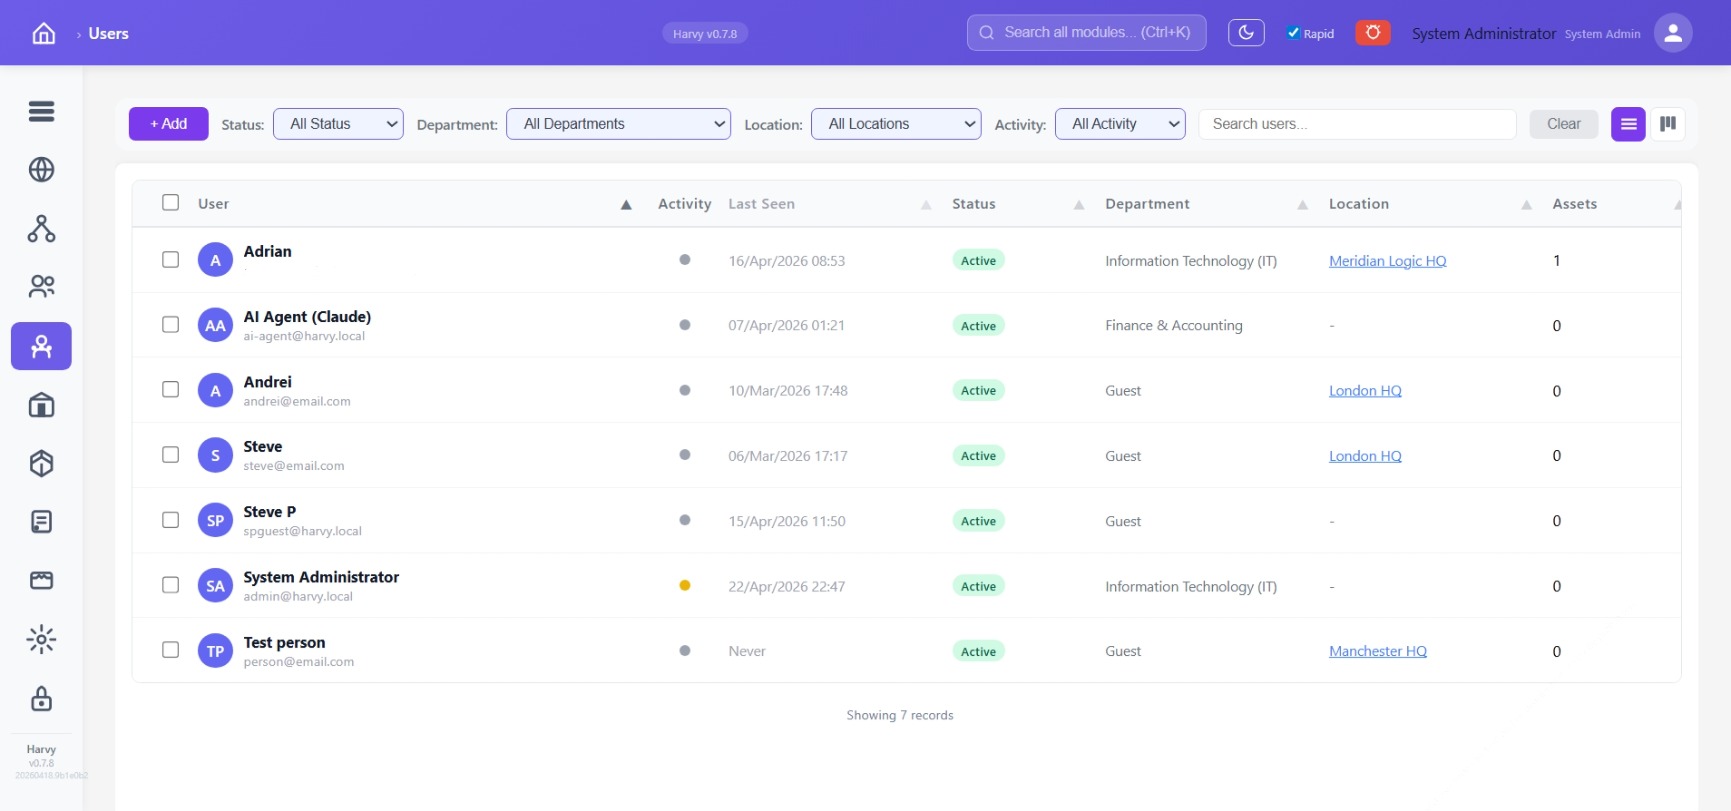
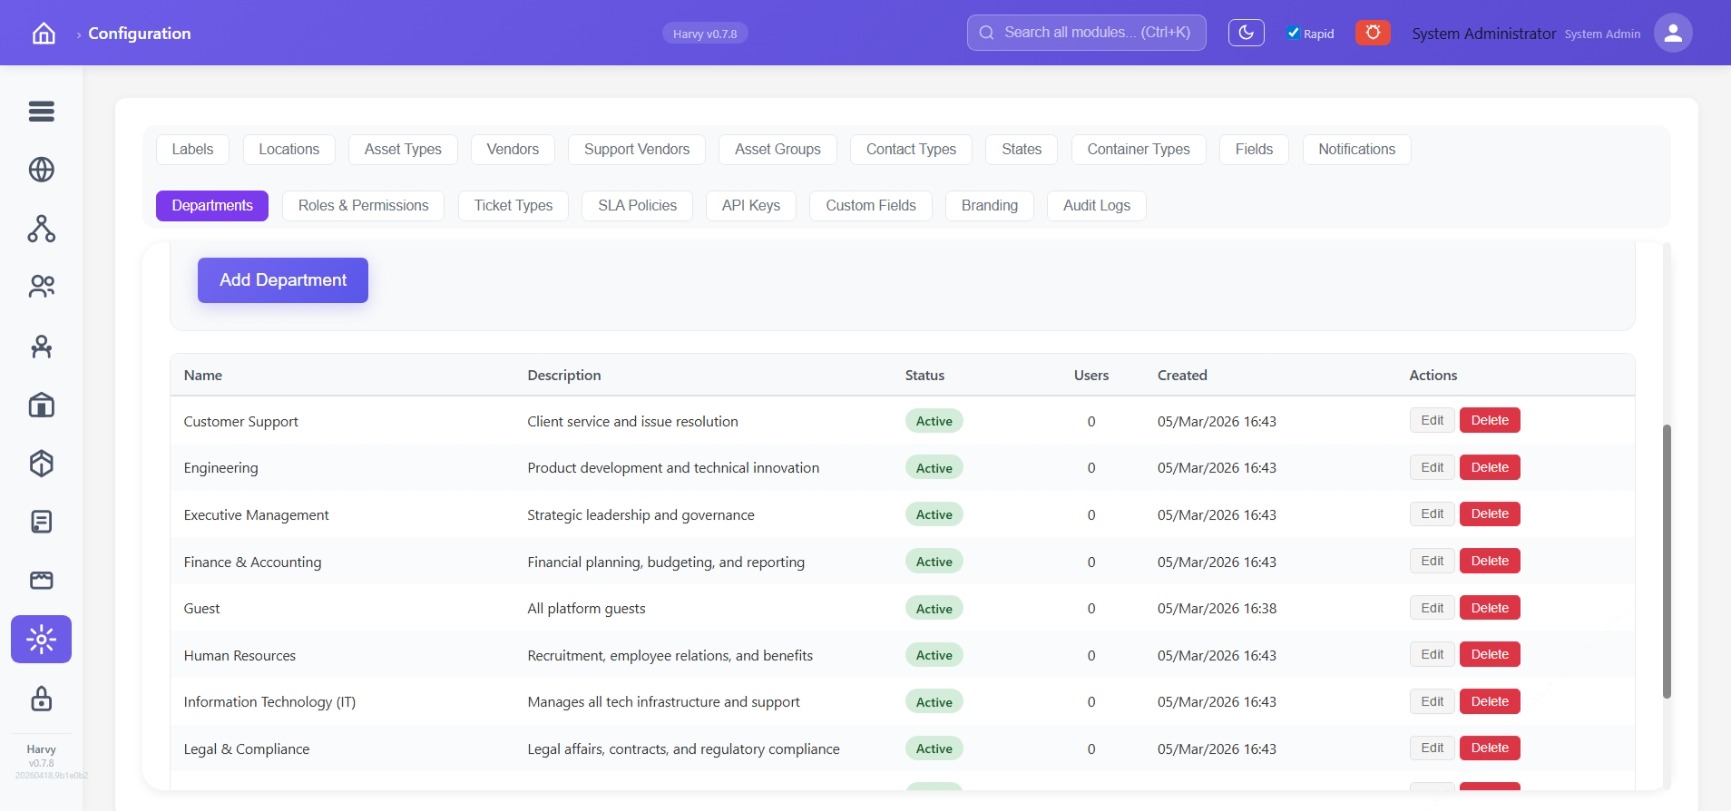
Scene 7 · Multi-tenant by design
One platform, many accounts, clean isolation.
Every entity — asset, ticket, location, diagram, licence, user — is scoped to an account. Two customers can each have a "Head Office" without colliding. Five built-in roles plus custom ones, granular permissions, full audit trail.
Per-account scoping
Every API call and UI view respects account boundaries by default. Cross-tenant data leakage isn't possible by accident.
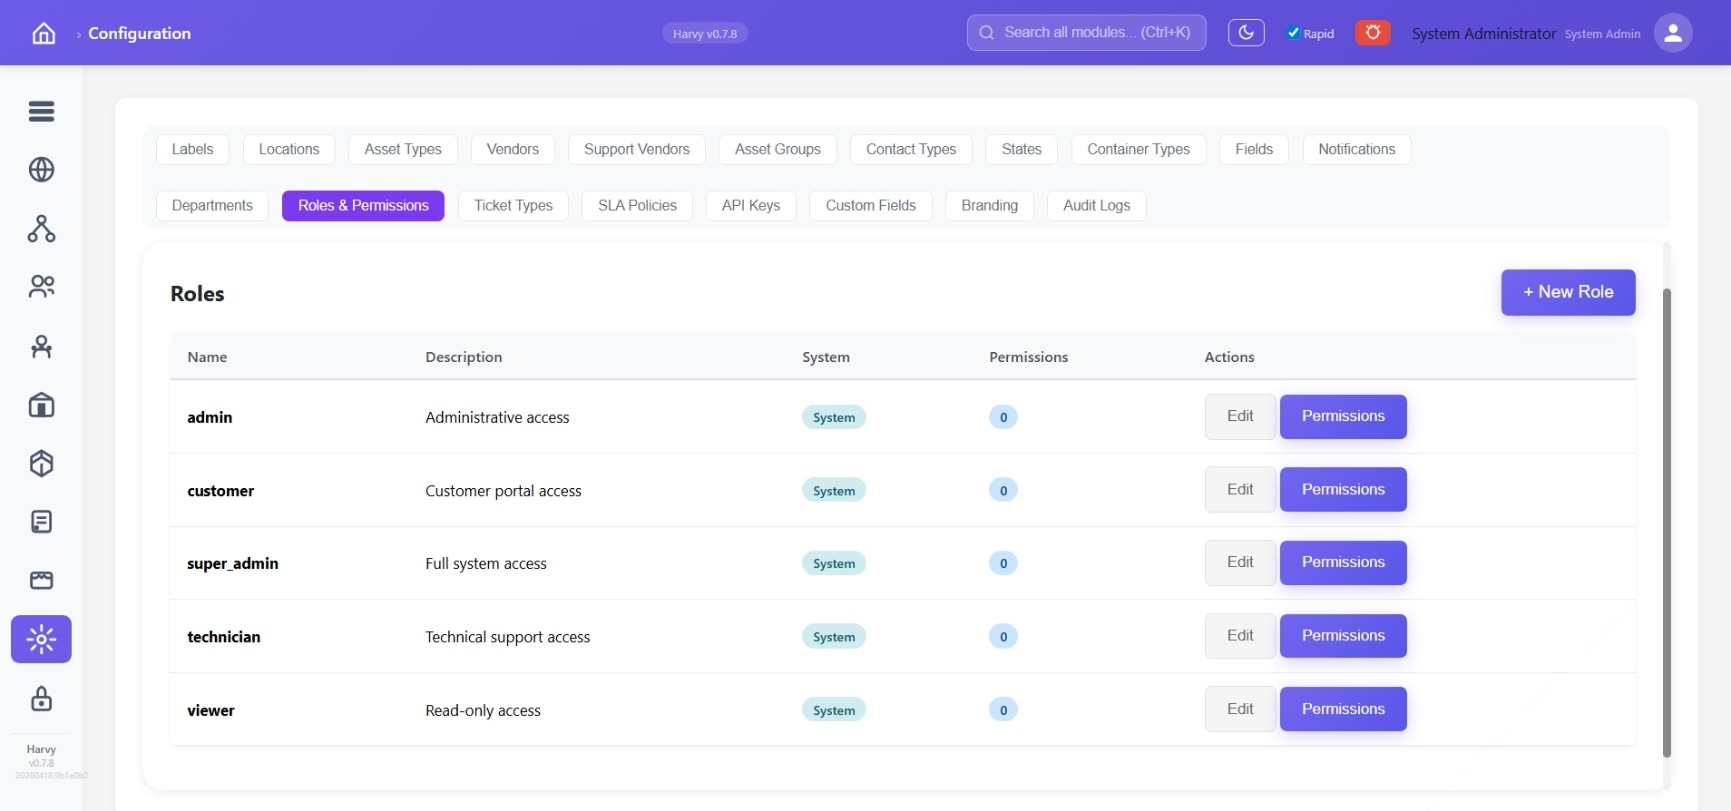
Roles & permissions
admin, customer, super_admin, technician, viewer — plus any custom role you define. Every permission audited.
Menu visibility
Hide top-level menus globally — useful when rolling features out progressively to early-access customers.
Custom fields & branding
Extend any entity without code. Per-tenant logo and colour — each customer sees their own identity.
Scene 8 · Operational maturity
Built to run, not just to look good.
A live system-status view for operators. TLS, bcrypt, CSP, HSTS, rate limiting. A migration gate that refuses to boot the backend unless every known database change has been applied to every tenant schema — so partial updates can't take down a shared environment.
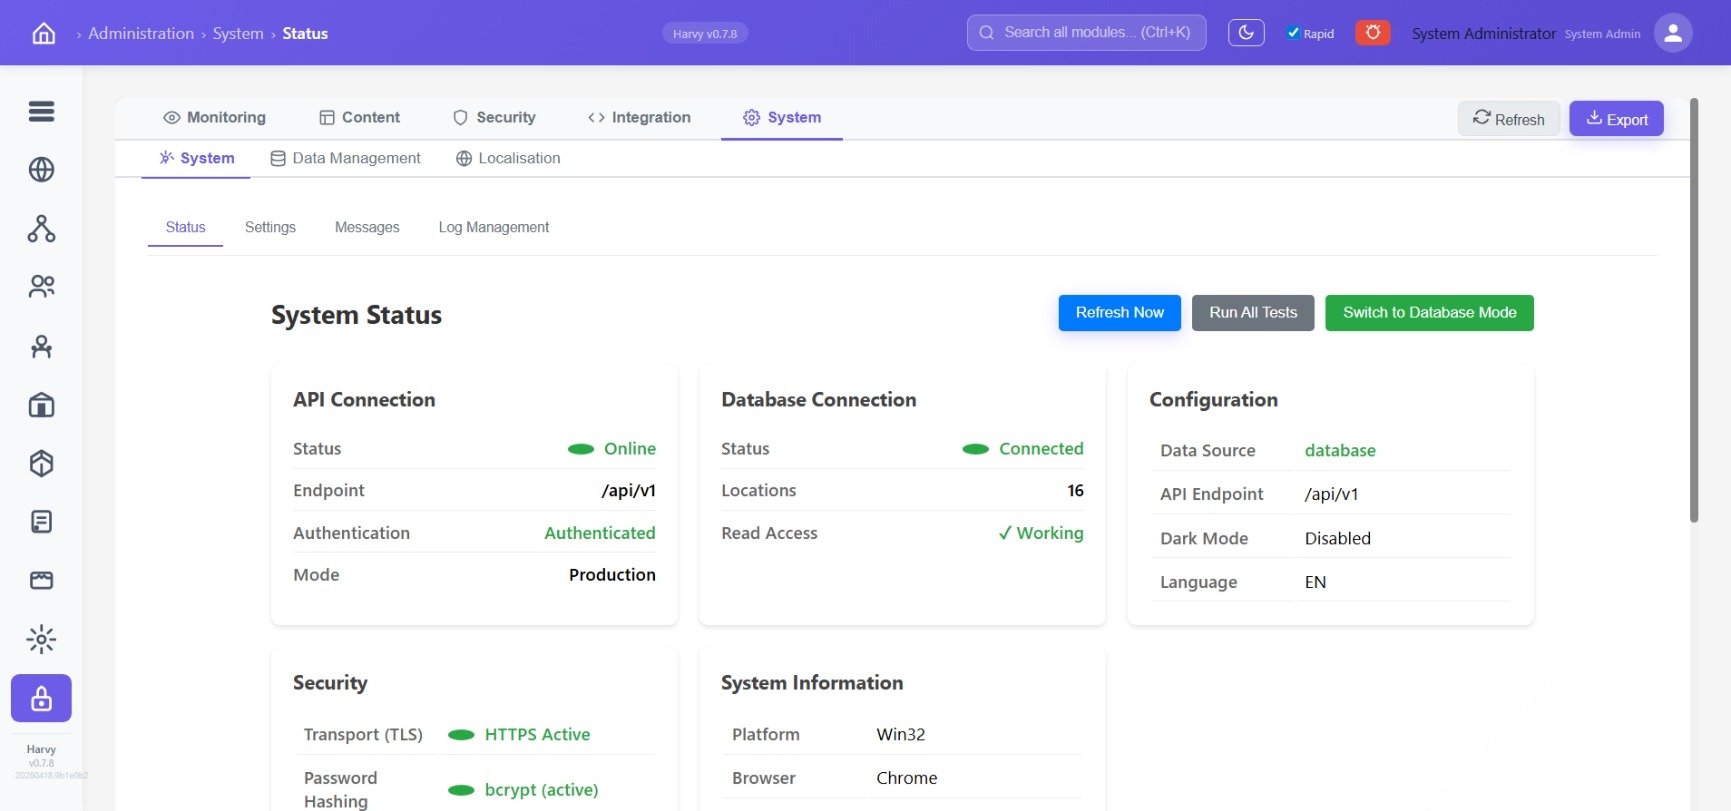
System status
API, database, security posture, PM2 process health, system info — all on one screen. Export to a snapshot for DR.
Encrypted backups
AES-256-GCM with PBKDF2-SHA512 key derivation. Restore is super-admin-only and rate-limited.
Post-deploy verifier
Every deploy runs 15 functional checks with auto-rollback on failure. Operators get paged the moment a deploy regresses.
Audit log
Settings writes, role changes, menu-visibility toggles, backup/restore — recorded with actor and timestamp.